Betterintelligence
Every source connected for you. All of it measured and reconciled to your books. No data team to hire, no infrastructure to run. ROI in days.

Hype Cycle for Analytics and Business Intelligence
JULY 2026
Hype Cycle for Data Science and Machine Learning
MAY 2026
Product
Ask any business question. Get an answer reconciled to your books.
Your business doesn’t need another dashboard. It needs faster decisions.
SQOR.ai is the autonomous decision layer that replaces the modeling work, the dashboard building and the analyst hours that normally sit between a question and its answer. It reads your data where it already lives and returns a decision in seconds.
Deploy in days, not quarters
Connect your data warehouse, or your applications, with read-only access, and answers start the same week. There is no modeling project, no infrastructure to stand up and no implementation lag.
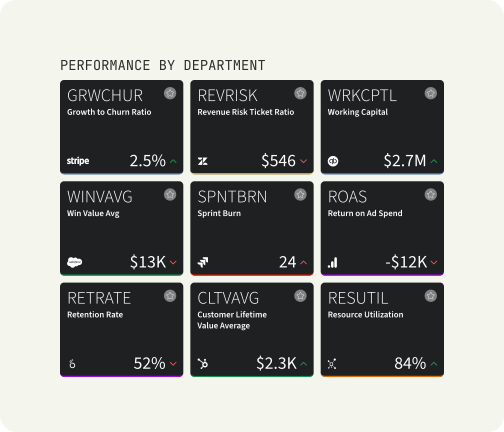
Thousands of KPIs, built from your data
Our proprietary KPI spawner reads your data estate and creates the key performance indicators (KPIs) your data supports, named from your own data and anchored to your own ledger. It builds them across every area of the company and across the relationships between areas, so silos disappear and the causal links between the parts of your business are fed to the AI instead of hidden from it.
See what others miss
SQOR.ai computes what is driving each number and forecasts where it is heading, so you know why a metric moved and what is coming, not just that it moved.
Get signals that never sleep
Machine learning computes every number and reconciles it to your source. Hundreds upon hundreds of agents then work that computed data continuously, explaining it, forecasting it and surfacing what needs attention before you have to ask.
One intelligence layer across every system.
Data from any source. Your data warehouse first, whether that is BigQuery, Snowflake, Databricks, Redshift, Azure Synapse or your own SQL estate. And your software-as-a-service (SaaS) applications right alongside it, because that is where the operating detail lives: the deals, the tickets, the orders, the shifts and the campaigns. The average company stores answers in 50 different places. SQOR.ai reads them all as one system.
Read-only, every time. You change nothing on your side, and if you have no warehouse we include one.



























Your data stays your data. SQOR.ai brings it into focus.
Read how we handle your data, in full.
Never writes to your systems
SQOR.ai is read-only and will never modify your data. It sits beside your audited books, never instead of them.
Business best practices built in
Industry metrics, logic and standards from our proprietary business-metric framework, ready from day one and traced to named authorities rather than invented.
No hallucinations. No drift.
Machine learning computes the number and reconciles it to your source. The language model only explains it and never holds it, so it cannot invent one, which is how hallucination is eliminated. It is also how drift is eliminated, meaning the same question cannot come back with a different number tomorrow.
Auditable outputs
Every figure traces to its data source, its calculation and its logic, with the date it was computed. Reconciliation is to the cent, not to a tolerance band.
Backed by Google Cloud
Marketplace listed. Enterprise security. Use existing Google Cloud credits.
Three answers. One intelligence.
Most dashboards can show you what happened. SQOR tells you why it happened, what is next and what to do about it. That is the paradigm shift in business intelligence, and it is how the benefit of this artificial-intelligence supercycle actually reaches a business instead of staying in a demo.
Causation
Reveal the relationships, dependencies, and hidden performance drivers so you understand why metrics move.
Prediction
Forecast likely outcomes, identify emerging risks, and surface leading indicators before they appear in reporting.
Recommendation
Prioritize the actions most likely to improve business outcomes so teams can move faster with confidence.
Solutions
Built to create value at any company. Engineered for the sponsor’s thesis.
SQOR.ai removes the friction between data and decisions for any operator running a business, and it is built to carry the value-creation thesis that private-equity and venture investors underwrite.
Private Equity & Venture
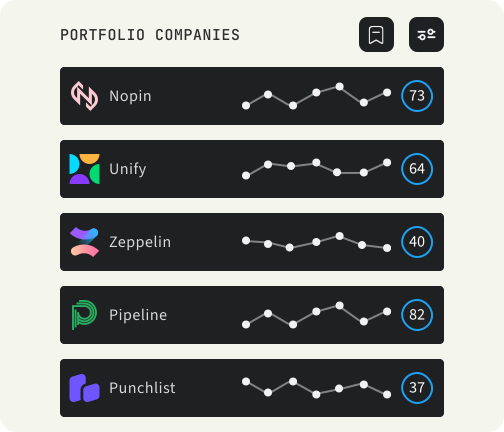
See across your portfolio. Act before value slips.
Get a live view across every company. Surface risks and opportunities early, understand what is driving performance, and act before issues show up in quarterly reporting or at exit. It is your board book, live. It is the same view a venture investor needs across a portfolio of companies that do not share a chart of accounts, because SQOR conforms each company’s data to one model rather than asking the companies to standardize first.
Executives
Turn data into decisions. Instantly.
Ask a real business question and get a real answer. No dashboards to build and no analysts to wait on. Just the truth behind your numbers, the moment you need it, whether you are creating value for a sponsor or for yourself.
Sr. Operators
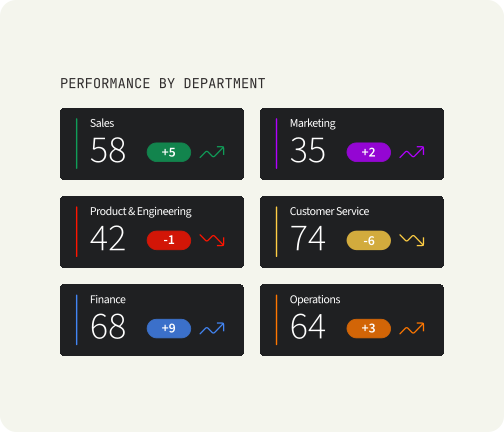
Know what’s driving performance on your team and beyond.
See the cross-functional drivers behind every KPI, get prescriptive actions automatically, and stop spending your week chasing data and explaining variance. Coverage stops being a budget question, so the corners of the business nobody could afford to measure get measured too.
Why SQOR?
Business intelligence is broken.
Enterprises spend millions collecting data, then millions more trying to understand it.
It takes forward-deployed engineers (FDEs), multi-quarter implementations, and dashboards that are outdated before they are fully deployed. That is not intelligence. That is overhead. And because real coverage cost an army you could never afford, you lit up a few corners of the business and left the rest dark.
SQOR.ai replaces that model. The platform does the modeling itself, so what it removes is the modeling layer, the dashboard build, and the analyst and engineer hours between a question and its answer. What it does not remove is your audited books, which it sits beside and never writes to, or your data warehouse, which you keep if you have one and which we include if you do not.
That is the armies of people and the months of time gone, with the source of truth left exactly where it belongs. Coverage stops being a budget question, so the whole business gets measured instead of a few corners of it.
Compare the ten main tools on fully-loaded cost, or read why business intelligence kept failing.
| SQOR.ai | Legacy business intelligence (BI) | Consultants & Analysts (FDEs) |
|---|---|---|
| Decisions & actions | Reports & visualizations | Slide decks & explanations |
| Causation & prediction | Historical metrics | Point-in-time analysis |
| Instant & proactive | Self-serve | Weeks to months |
| Automatic | User-driven | Analyst-dependent |
| Scales across all data | Limited by setup & queries | Linear with headcount |
| Usage-based pricing | Tool & team overhead | Even higher labor costs |

Hype Cycle for Analytics and Business Intelligence
JULY 2026
Hype Cycle for Data Science and Machine Learning
MAY 2026
The hype is a reality. Today.
Gartner is the world authority on innovative technologies.
Thousands of vendors compete for a mention in their Hype Cycle reports. Most never get one.
SQOR.ai was named in two this year, including in a category Gartner rates Transformational, their highest benefit rating.1
That category is Vibe Analytics, and SQOR.ai is named as a Sample Vendor in that profile.
Here is what it means in plain English. You stop building views and reading charts. You ask in your own words, the platform computes the answer from your own data, explains what caused it, forecasts where it is heading and recommends the move. The analysis stops being something a person produces and becomes something the system produces.
Read what Vibe Analytics is, and what it replaces.
Sources:
Gartner, "Hype Cycle for Data Science and Machine Learning, 2026," JC Martel, Afraz Jaffri, 8 May 2026, ID G00846574.
Gartner, "Hype Cycle for Analytics and Business Intelligence, 2026," Jamie O'Brien, Edgar Macari, 2 July 2026, ID G00846627.
Pricing
Enterprise intelligence without enterprise overhead.
Pricing is based on query volume, not seats, so your costs are predictable as usage scales and everyone who needs an answer can have one. No forward-deployed engineers. No custom implementation teams. No months-long setup.
Seats are unlimited and pricing scales with the questions your organization asks, not the number of people who need answers. Onboarding covers connecting your sources, capturing the questions your leadership actually asks, and getting your people testing on your own data.
Team Pro
For functional leaders driving decisions across a business.
Talk to us
- 135,000 queries per year
- Ideal for approximately 25 users*
- Unlimited data sources, warehouse or application (up to 1TB)
- Unlimited seats
- Data warehouse included
Team Premium
For teams that need alignment around one version of reality.
Talk to us
- 270,000 queries per year
- Ideal for approximately 50 users*
- Unlimited data sources, warehouse or application (up to 1TB)
- Unlimited seats
- Data warehouse included
Enterprise
For organizations that need to turn data into coordinated action.
Talk to us
- 540,000 queries per year, scaling to 2.7 million
- Ideal for 100 to 500+ users*
- Unlimited data sources, warehouse or application (up to 1TB)
- Unlimited seats
- Data warehouse included
*Seats are unlimited. Approximate user number based on an average of 15 queries per day per average user. Every engagement starts at the twenty-five-user tier. Subscription commitment is annual, and fund-level agreements and portfolio volume economics are available.
Questions
The questions people actually ask.
Including the hard ones. If something here is not answered plainly enough, ask us directly and we will answer it the same way.
What is SQOR.ai?
SQOR.ai is an autonomous decision-intelligence platform. It connects to your data wherever it lives, builds your company’s entire measurement layer itself, and answers business questions in plain language with figures computed from your own data and reconciled to your ledger. It replaces the modeling work, the dashboard building and the analyst hours that normally sit between a question and its answer.
Why business intelligence kept failing, and what replaced it
What is Vibe Analytics?
Vibe Analytics is the category SQOR.ai is built for, and it is what replaces the interactive dashboard. Instead of a person building a view and interpreting a chart, you ask in plain language, the platform computes the answer from your own data, explains what caused the number to move, forecasts where it is heading and recommends the action to take. The work moves from the person to the platform. SQOR.ai is named in this category in the Gartner Hype Cycle for Analytics and Business Intelligence, 2026.
What happens if our data is messy or non-standard?
It still works, and here is the mechanism rather than a promise. Every join between your tables is validated against the actual data before it is used, and a key that is not unique is quarantined rather than silently multiplying your rows. A number stored as text is detected and cast rather than silently summed to zero. Every metric is reconciled to your ledger before it is allowed to serve, and when a figure cannot be reconciled the platform withholds it and tells you, rather than answering anyway. Messy data changes what we can answer. It never changes whether the answer is true. Anything we cannot bind comes back to you as a named list of exactly what to connect next, so our failure mode is a written gap list, not a wrong number.
Our business is unusual. Will standard KPIs fit it?
There is no fixed list to fit. Our proprietary KPI spawner reads your data estate and creates the metrics your data actually supports, named from your own data, bound to your own columns and anchored to your own ledger. A business with unconventional revenue recognition, an unusual service model or its own operating vocabulary is the normal case, not the exception, because nothing was precomputed against someone else’s catalog. Where your team already has calculation logic that works, that logic is enshrined and attributed rather than replaced.
What are the AI agents actually doing?
Two different things, and keeping them separate is the whole design. Machine learning computes every number and reconciles it to your source. Hundreds upon hundreds of agents then work on that already-computed data, explaining what drove it, forecasting where it goes, generating and scoring the recommended actions, and watching for what needs your attention. No agent produces a figure, and none of them can change one.
How do you prevent hallucinated or wrong numbers?
The language model never holds the number. Machine learning computes each figure and reconciles it to your source, and the model’s only job is to explain it, so there is no point at which a figure can be invented. That eliminates hallucination. It also eliminates drift, which means the same question cannot come back with a different number tomorrow. When the platform cannot reconcile a figure, it withholds it and says so.
Does the same question always return the same answer?
Yes, and that is a structural property rather than a tuning setting. The answer to a governed question is computed, reconciled and stored, so asking it twice returns the identical figure, and two people asking it in different words get the same number. An investment committee cannot underwrite a number that changes when you ask twice, which is why this is the entry requirement rather than a feature.
What does SQOR.ai do when it isn’t sure?
It withholds the answer and tells you, rather than guessing. Then it goes and builds the corrected metric so the question is answerable the next time it is asked. Withholding instead of fabricating is the default.
Do we need a data warehouse, and what if we already have one?
If you have one, SQOR reads it. BigQuery, Snowflake, Databricks, Redshift, Azure Synapse and your own SQL estate are all sources, and using SQOR does not add a modeling layer on top of it. If you do not have one, a warehouse is included in your subscription and there is no separate compute meter to pay. Your SaaS applications are read alongside the warehouse, not instead of it, because that is where the operating detail lives.
Does SQOR.ai replace our BI tools and our data team?
It replaces the work, and the boundary matters. What it replaces is the semantic modeling layer, the dashboard building and maintenance, and the analyst and engineer hours between a question and its answer. What it never replaces is your audited books, which it sits beside and never writes to. Teams typically run SQOR alongside an incumbent tool during a read-only evaluation, because nothing has to be torn out for you to compare answers.
What do you need from us to be live in two weeks?
Read-only access to the sources you want answered, which is usually your warehouse and a short list of applications, and one person who can confirm what your key figures should reconcile to. That is the whole day-one ask. There is no data modeling for your team to do, no dashboards to specify and no implementation project to staff. Where a brand-new connector is required it adds a little time, and we ingest that data directly in the meantime so you see value rather than waiting.
Why do private-equity and venture investors use SQOR.ai?
Because value creation is measured across companies that do not share a chart of accounts, and SQOR conforms each company’s data to one model rather than asking every portfolio company to standardize first. A sponsor gets a live view across the portfolio, the drivers behind each company’s performance, and the risks early enough to act before they appear in quarterly reporting or at exit. The same machinery works for any operator creating value in a single business, which is the point: the portfolio view is the general product, aimed.
Does SQOR.ai replace our data team?
It replaces the production work, not the judgment. Building and rebuilding views, hand-assembling the same report every month, and answering one question in six formats for six people is what the platform does. What is left is what your data people were hired for, which is deciding what the business should do next. The calculation logic they have built up over years is enshrined and attributed rather than replaced, and the request queue that made them the bottleneck for every question in the company stops forming.
How can we find real money with better visibility?
In two places, and most cost exercises skip both. The first is what you spend producing information: licenses, the warehouse underneath, and the fully-loaded salaries of everyone whose output is a report. At a mid-sized multi-site operator that is commonly well over a million a year, and most of it sits in payroll rather than in a software line. The second is what you lose because nobody measures it: revenue recognized incorrectly, discounts given outside policy, marketing money sitting in weak territories, and the bottom quartile of locations nobody has time to look at. Those four are usually larger than the first and appear in no ledger as a loss.
Where is our business losing money that we cannot see?
Almost always in the parts you never instrumented, because instrumenting them cost analyst hours nobody could justify. In practice that means the bottom quartile of locations, the products with small volumes and thin margins, the customers who quietly became unprofitable, and the processes where an exception became the norm. The common factor is not that these are hard to measure. It is that nobody was ever funded to measure them, which is the constraint that changes when the platform generates the measurement layer itself.
Let’s get to work.
Get in touch with our team and we’ll walk you through what SQOR.ai can do for your business.